
Speakers: Kam Kalantar-Zadeh MD, Becky Brosch RD, Joanne Cooke RD
This is a summary of a presentation I attended at the National Kidney Foundation Spring Clinical Meeting.
Objectives:
- Describes the evidence supporting malnutrition assessment in CKD
- Identify the components of MIS
- Identify the relationship between frailty and nutrition in older adults with CKD
Background
29% of patients have malnutrition or Protein-Energy Wasting (PEW). Emphasized that different vocabularies to describes malnutrition or PEW, but either terms can work.
What causes malnutrition in the CKD population?
Malnutrition-Inflammation is a complex syndrome with several identified cause, including uremic toxins and inadequate nutrition and protein.
What are the recommendations for protein in CKD?
Low protein vs high protein diets in CKD – if a person is on dialysis, they need more protein, that isn’t a debatable point. Ideal protein targets pre-dialysis remain an area for further study.
How can we categorize or assess nutritional status?
- Chemistry – serum albumin (the strongest predictor of survival), prealbumin, cholesterol levels
- Muscle mass – muscle wasting, low mid-arm circumference and creatinine appearance
- Body mass – Under 23kg/m2, unintentional weight loss, total body fat percentage
- Dietary Intake – Unintentional low protein and energy intake
- Nutrition scores – SGA or MIS
What is the SGA?
Canadian surgeons created the subjective global assessment (SGA) tool approximately 20 years ago. The SGA was created to assess nutritional status. Nutritional status significantly impacts post-surgery recovery time.
Using an SGA to conduct nutrition assessments was recommended in the original DOQI guidelines. DOQI was the guideline body before KDOQI, which stood for the Dialysis Outcome Quality initiative. There were three possible SGA scores – A, B and C.
The Initial components were:
- Weight change – post dialysis dry weight
- Dietary Intake – do you eat enough?
- GI symptoms – e.g. stomach pain, diarrhea
- Functional capacity – are you able to get through your day?
- Multi-morbidity
- Fat Stores
- Signs of muscle wasting
- Peripheral edema
The assessment of fat stores and muscle wasting is part of the nutrition-focused physical exam. For adults on dialysis, peripheral edema is not considered a nutrition-related finding.
A is good, B is middle, C is bad. The goal isn’t to take an average, but to be guided by clinical sense after looking at each assessment components. Researchers were able to demonstrate that these results are relatively reproducible.
What is the 7-point SGA?
The 7-point SGA was an evolution of the original SGA. The 7-point SGA was invented in the Canada and USA. Each component is assigned a score between 1-7. The limitations of the 7-point SGA were:
- semi-quantitative
- it is subjective
The more a clinician uses it, the more proficient they become. It is considered a useful and valid nutrition assessment tool.
The advantages of the 7-point SGA are:
- can pick up concerns sooner than the traditional A, B, C SGA.
- better pick up improvements in nutritional status to better enables evaluation of nutrition interventions.
The 7-point SGA assigns a final rating between 1-7. The higher the score, the better nourished.
Why was the MIS developed?
The MIS was developed specifically for the dialysis population. The concern was that the SGA didn’t consider several important components that were well known to impact outcomes in the dialysis population. Specifically, the MIS adds consideration of:
- BMI – specifically low BMI, BMI’s under 20.
- Serum Albumin
- Total Iron Binding Capacity (TIBC)
MIS scores are highly correlated with CRP and other inflammation markers, which are good predictors of survival. Each component of the MIS is assigned a clearly defined ranking between 0-3. The component scores are added together to yield a final score between 0-30. Higher scores indicate worse nutritional status.
Why include Albumin and BMI in MIS?
Low albumin and BMI are good predictors of mortality. What this means is that patients with low levels are at a higher risk of death, but not necessarily that they will die immediately.
Why include TIBC in MIS?
TIBC correlates very well with nutritional status. Malnourished HB patients have lower serum TIBC. TIBC is a marker of nutritional status after adjustment for age, vintage and other confounders. The benefit of this measure is that is routinely measured as part of standards lab monitoring protocols in kidney care clinics.
Why does MIS matter?
MIS scores are closely related to mortality in CKD, dialysis and post-transplant patients. Higher scores are associated with a higher risk of mortality. It considered a very useful tool for risk stratification of our patients.
What are the components of MIS?
- Weight changes – graded on changes ranging between 0% (no concerns) to above 15% (severe weight loss)
- Dietary Intake – can ask the patients to describe how their eating pattern is changing for their baseline. Clinicians can also refer to previously documented 24 hour recalls for assigning this component score
- Gi Symptoms – specifically asking about nausea, vomiting or diarrhea. Consider GI symptoms within the context of what is normal for the patient.
- Functional Capacity/Frailty Score – incremental changes in functional status can be assessed. Do they report any changes in their stamina? Or are they experiencing severe losses of function?
- Co-morbid conditions – consider length of time on dialysis; is there any increase in metabolic demands? for example is there a disease state impacting their ADL (e.g someone with diabetes or cancer would score 3-5). A component score of 1-2 indicates significant disease impacts on nutritional status (e.g. HIV or AIDs)
- Muscle wasting
- Fat scores
- BMI – scoring of 0 is given if BMI is above 20.
- Albumin
- TIBC
Each component is scored between 0 (indicates no concerns) to 3 (indicated severe changes) Total score is between 0-30.
How to assess muscle wasting?
Aim for at least 3 areas – temple, shoulders, clavicle or hands. My personal favorite is the temple, hands and clavicle.
- Temples: Look for any hallowed-out areas.
- Clavicle: With the clavicle consider that this bone is more prominent in females than in males.
- Shoulders: For shoulder assessments consider that the should be rounded. If the should looks square this can indicate severe muscle wasting.
- Hand: Interosseous muscle – get patients to put their thumb to finger together. If there is scooping this indicated malnourishment.
How to assess fat stores?
My favourite areas for assessing fat stores are the orbital and tricep area.
- Orbital (eye pad under the eye): should look bouncy, bulgy. Under the cheek bones there should also be a bulge.
- Thoracic and Lumber: Ribs shouldn’t be prominent
- Triceps: should feel like bread dough. Severe depletion is when your fingers can touch if you press the tricep area.
How to assess edema?
Press down into the skin for up to 5 seconds. Consider how deep the press goes into the skin.
On the 7-point SGA a score of:
- 6-7 indicates minimal edema
- 3 to 5 will be pitting edema up to the knee
- 1 to 2 indicates significant amounts of pitting edema above the knee.
Other signs and symptoms of edema can include not fitting their regular shoes or jewelry, rapid weight gain, shortness of breadth.
Why frailty matters?
As CKD advances, frailty rates increase. Being women, having diabetes and older age increases frailty scores. Frailty is associated with poorer quality of life, mortality, hospitalizations and falls.
Frailty is multi-dimensional – including systemic CKD factors and poorer nutrition and sarcopenia.
How is frailty assessed?
The five tools to assess frailty are:
- Tool 1: Comprehensive Geriatric Assessment
- Tool 2: Fried Frailty Phenotype (e.g Hand grip strength below 20th percentile)
- Tool 3: Short Physical Performance Battery – sit to stand time – goal is 5 times in 11 seconds.
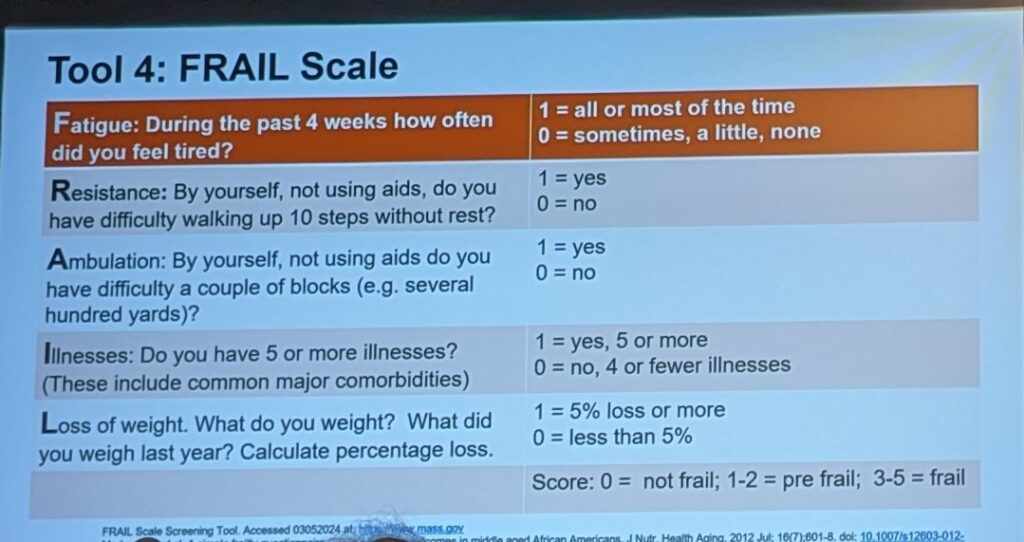
- Tool 4: FRAIL Scale – a series of a few questions asking about health.
- Tool 5: Grip Strength – functionality surrogate
How do you reduce the risk of frailty?
- Aim for adequate energy and protein intake
- Eat a variety of plant proteins
- Adjust the ratio of animal and plant proteins
- ONS after exercise has synergistic benefit
How to reduce inflammation?
- Limit phosphate additives
- Limit inflammatory foods (added sugar, refined flour)
- Limit processed foods
- Support the gut microbiome


3 thoughts on “Malnutrition/ MIS and Functional Status”