Hot off the press! Or well, only a few short months off the press. Today’s article comes from the November 2024 issue of the Journal of Renal Nutrition:
I wanted to look into this article as it overlaps with one of my main areas of interest – potassium. So let’s dig in.
Who participated in the study?
This study was conducted in Tokyo, Japan. Participants were recruited from kidney care clinics or during a hospital admission. Participants had to be older than 20 and have CKD. The study defined having CKD as:
- Having an eGFR less than 60
- Having a history of treated nephrotic syndrome or glomerulonephritis
- 3 month history of proteinuria or hematuria
Who did not participate in the study?
People on dialysis, people with cancer and people with an eGFR above 90.
How did they assess food intake?
The authors reported using the BDHQ, a validated food and beverage questionnaire that asks about intake over the last month. I was not previously familiar with the BDHQ. Off the hop, this is probably a good thing since I don’t work in Japan. Ideally a diet assessment tool should be specific to the population it is studying (more about why that matters here).
Based on the authors description this is a food frequency questionnaire. The authors reported that the BDHQ had been previously validated against multi-day diet records among Japanese individuals. However, they did not specify that they validated it to measure potassium. They also did not mention whether they validated the tool against biomarkers (for why that might matter click here).
How did the researchers measure serum potassium and define hyperkalemia?
The authors state that most of the serum potassium results were non-fasting. Based on their wording, my assumption is that only one measurement of serum potassium was used. However, this isn’t explicitly stated. If they only checked potassium once, I would describe this as a limitation, especially if they used a sample drawn during the hospital admission where the patients were recruited from—since an acute illness might affect potassium levels and not reflect normal values).
They defined hyperkalemia as a serum potassium at or above 5.0 mEq/L Which fortunately for me, is the same as 5.0mmol/L, making it easy to interpret!
What other lab results were considered in this study?
The other lab tests used in this study included:
- CBC
- Renal and liver function tests
- Electrolytes
- Albumin
- Venous blood gasses to measure pH, bicarbonate and pCO2
- Spot urine samples were collected to measure urinary sodium, potassium, creatinine and protein.
The authors specify that they used a Japanese specific formula to calculate eGFR. They also specified that the spot urine sample was collected on the same day as the blood test.
They do not specify the time relationship between the diet history of the blood sample. So for example – was the blood sample taken 1 or 2 months before the diet history or vice versa. Based on the description in the methods, we don’t know.
What other information did they collect about participants?
Quite a bit really – but the ones that caught my eye as particularly relevant to this study was:
- Medication use, including potassium binders, sodium bicarbonate and RAASi
- Stool frequency, including a question about diarrhea
The researchers collected the medication list from the hospital’s records, but they do not state whether they verified the list with the patients. They also do not clarify whether these medications were what was prescribed during the hospital admission or if they were the usual home medications
What statistical testing did they perform?
To talk about all the different statistical tests really well I would need to do a whole other series of potassium (which I should probably add to my to do list!), but here are some of the important things that caught my eye.
First, the authors looked at their results separately for people who were and were not taking potassium binders. This is a good thing since potassium binders could make a big impact on how serum potassium levels correlated with dietary potassium intake.
In another analysis, using only people who weren’t taking potassium binders, they looked to see what was happening in people who had an eGFR below and above 30. This is also beneficial because many studies—and many of us clinicians have observed—that potassium homeostasis tends to be preserved at higher eGFRs, reducing the likelihood of an association between potassium intake and serum levels.
In another analysis, the authors looked at how their results changed when they divided their results by time between the lab draw and the diet history. Their cut point was within 30 days or more than 30 days. Aha! Here is the answer to one of my previous questions – what was the time lapse between the diet history and the lab draw? If the analysis looked at less then or more than 30 days this gives us a clue that the time lapse for some participants was quite large. For those of us working in clinical care for hyperkalemia management, the focus really tends to be what you eat close to the lab draw, not what you ate last month (if you want to know what that matters, read more about that here).
What did they find?
Ok, there is a lot to unpack here, so I will go through their results over several sections. But one thing I am reading for is to see if they compared the spot urine potassium to the diet history. I am curious to see this result, though they didn’t describe doing analysis this in the statistics section. If they didn’t do it, this seems like a miss to me, as it would have been an opportunity to validate their diet history against another measure of potassium intake.
Who were their participants?
Their final sample size was 285 people with an average age of 72. 33% were female, 67% were male. The median eGFR was 31.2, with 60% of the study population having Stage 3b or 4 CKD.
The majority of the participants were recruited from the hospital. The mean serum potassium was 4.4mEq/L, with 13.3% having hyperkalemia.
What did the participants eat?
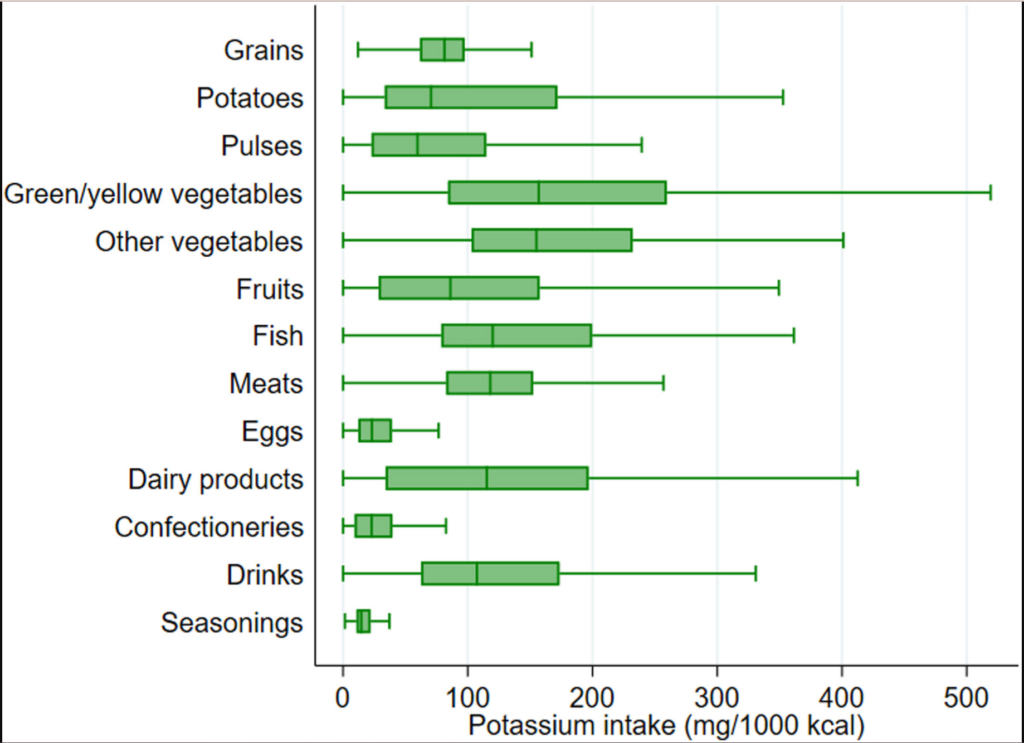
The mean energy intake was ~1700kcal per day. The median potassium intake was 2209mg per day, working out to 1338mg of potassium per every 1000kcal consumed.
By food group, the two largest contributors of dietary potassium were green and yellow vegetables at 157mg/1000kcal and other vegetables 155mg/1000kcal. Using the figure you can see that the lowest contributors were seasonings, eggs and confectionary.
How did food intake associate with serum levels?
Total potassium intake and serum levels had a weak association. But let’s take a closer look at their table to see how the intake of different types of associated with serum levels.
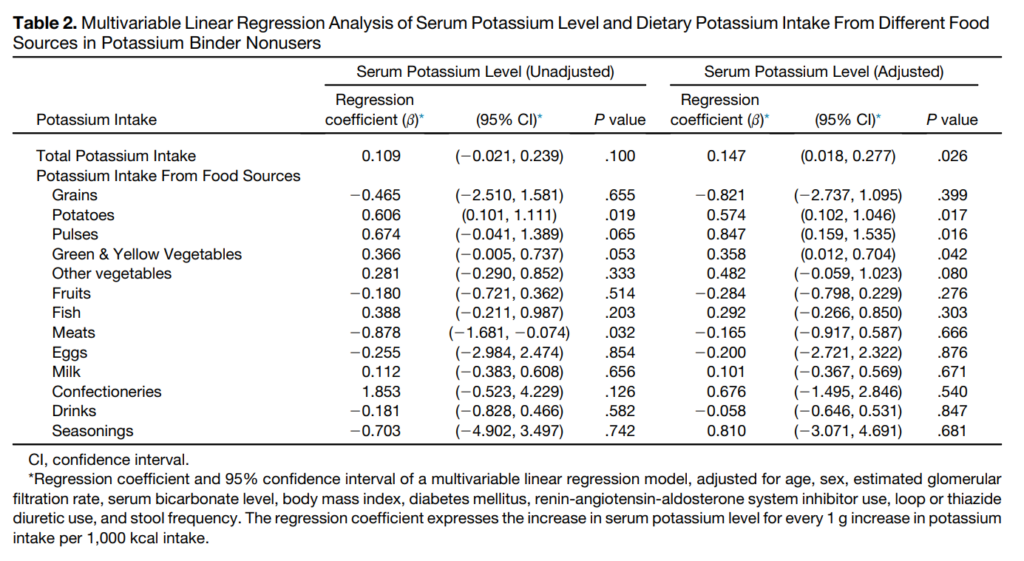
Ok, I want to walk us through interpreting this table. The authors preformed two analyses using potassium intake from the different foods and serum levels. In the first set of results they just used the raw numbers. In the second set of results, called the adjusted model, the authors told their statistical software to consider all of the variables listed in the table description (e.g. age, sex, eGFR…).
What does the p-value tell us in a regression analysis?
What the p-values tell us in this table is whether or not we can trust the results of the regression coefficient. Or whether or not we think that the results from this study would be found in the general population. You can see that in the unadjusted model only potatoes reaches the classic 0.05 p-value threshold. You can also tell this by looking at the 95% CI (the 95% Confidence Interval), since it is the only one that doesn’t cross 0. In the adjusted model, total potassium intake, potatoes and pulses all have p-values less 0.05.
What does the regression coefficient tell us?
The regression coefficients tells us about both the direction and strength of the association. First the direction, if the number is positive as one value goes up so does the other. If the number is negative, as one number goes up, the other goes down.
In this case, for the unadjusted model when intake of grains, fruits, meats, eggs, drinks and seasonings went up, serum potassium went down. Though, consider that based on the p-values and confidence intervals, we can not extend the results from this study to the general population.
However, for potatoes, the confidence interval and p-value suggest the result could be applied to the general population. When we look at the correlation coefficient we see that the number is positive – as potato intake goes up, so does the potassium. We can also look at the strength or magnitude of the association. In this case, for every 1 g increase per 1000kcal of potato someone consumed, the model predicts that the serum potassium level will also increase by 0.6 for the unadjusted and 0.5 for the adjusted. Though the confidence interval tells us that the true value could range anywhere between 0.1 to 1.0mEq/L.
Is that a big effect?
Correction – This section was edited after the initial publish date as I realized I made an error in the units.
In order to increase dietary intake by 1g or 1000mg of potassium from potatoes alone, someone would need to eat approximately 263g of potatoes (using the Canadian Nutrient File’s info of 379mg of potassium for every 100g of boiled potatoes). This is a fairly big portion of potatoes.
And according to these results, if someone consumed 263g of potatoes per 10000kcal then their serum potassium would increase by 0.1-1.0mEq/L. I would describe this as a moderate effect. In my clinical practice most people aren’t consuming ~250g of potatoes for every 1000kcal.
Can we trust these results?
For me, the most important part of determining whether I can trust these results is examining the validation studies conducted on the diet history tool used. The article cites two references that make checking the validation fairly quick and easy.
The first validation study was:
In this study, the food frequency questionnaire significantly underestimated or overestimated mean potato and pulse intake compared to food records. This study did not compare nutrient intake estimates.

The second validation study was:
In this study, comparing the food frequency questionnaire to semi-weighed diet records revealed a similar estimated potassium intake. However, the estimated intake of potatoes and pulses was significantly different!

At this point, I worry about trusting the results of the potatoes and pulses. Additionally, unfortunately the authors did not report how their urine potassium estimates compared to their diet records estimates.
Take Aways
This ended up being a long post, so thanks for sticking with it.
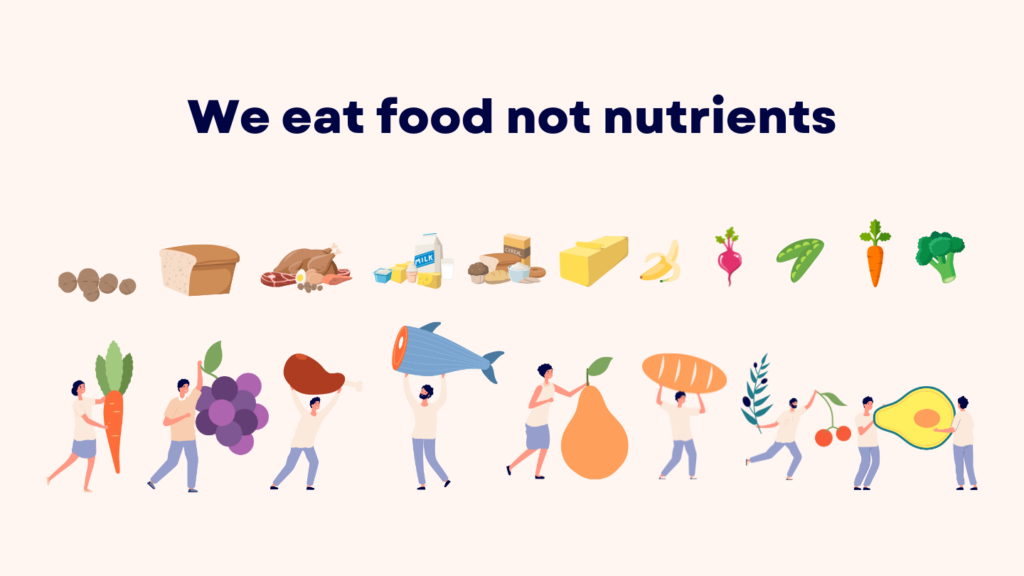
I love the concept of this study and I love how the authors were looking at specific food sources vs total potassium intake alone. Because, as we all know, we eat food, not nutrients. So this is exciting to see a study that considers foods as opposed to a nutrient. It makes the potential applicability of this work in clinical practice super high.
That being said, this there is a lot more research needed before we should tell all our patients to stop eating potatoes and pulses due to a potential link with hyperkalemia. The main limitations of this study, as I see them are:
- Accuracy: Two separate studies found that the diet history tool provided significantly different estimates of potato and pulse intake.
- Proximity: The diet history does not appear to have been at all proximate to the serum potassium value, which makes interpreting the lab result in terms of food intake problematic
- Reliability: The study assessed potassium intake using only one serum potassium value, which included lab draws taken during hospital admissions when patients may have been experiencing acute illnesses that could have affected their serum potassium levels.