
I saw a question about this on the Build Up Renal Dietitian facebook page. I thought it would make for an interesting blog post. The question was about a low eGFR in an athlete. And while there could be plenty of things occurring, my first thoughts jumped to muscle mass. Depending on the type of athlete (specifically those with high muscle mass), the eGFR could be falsely lowered.
Since this question comes up a lot, if you want to know more about Low eGFR in Athletes – check out my full series here.
Don’t forget the “e” at the beginning of eGFR
First things first, let’s consider the “e” at the beginning of eGFR. It stands for estimated. That means that the eGFRs on our lab reports are estimations of true glomerular filtration rate or kidney function. mGFR or measured GFRs are less frequently done in clinical practice, though are done in research.
Muscle impacts eGFR calculations
In this 2020 article published in the lancet, the authors used DXA scans to determine the muscle mass of adults post kidney transplant, and examined how their muscle mass impacted the quality of the eGFR calculation compared to a true measured GFR.
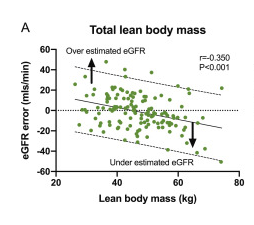
The authors reported that eGFR was falsely reduced by -5·9 ± 1·4 mls/min per 10 kg lean mass. Adipose and percent body fat did not cause any errors. Cachexia also prevented accurate estimation of eGFR.
What is the formula to calculate eGFR?
There are different formulas for calculating eGFR. I see the CKD-EPI formula most in my clinical practice. According to this article, the formula looks like:
GFR = 141 × min(Scr/κ, 1)α × max(Scr/κ, 1)-1.209 × 0.993Age × 1.018 [if female] or 1.159 [if black], where:
- Scr is serum creatinine
- κ is 0.7 for females and 0.9 for males
- α is -0.329 for females and -0.411 for males
- min indicates the minimum of Scr/κor 1″
Yuck! That’s a lot to look at at 6:18am on a Saturday (or probably any time!).
Let’s use an eGFR calculator instead!
You can also check out this eGFR calculator from the National Kidney Foundation here. When I have students with me I typically send them to this website to see how the different formula’s can generate slightly different eGFR readings.
I also get them to adjust for body surface area and will get them to enter the actual height and weight of our patients. Consider that in most cases the lab doesn’t have your patient’s height and weight and so they use a standard body surface area number.
For many people that probably works just fine. And for following a trend for the same person overtime it will definitely tell you if they are going up or down. But, if your patient has cachexia or a very high muscle mass, then this calculation may not be very accurate. And what’s more if while you are following someone they BECOME cachexic or start body building, then their eGFR calculations may show a change that isn’t accurate:
- For those who develop cachexia – their eGFR might appear to go up (or stay the same when in fact their kidney function is declining).
- For those who start body building – their eGFR might appear to go down.
Why is there a link between muscle mass and eGFR calculations?
The key lab value for calculating eGFR is creatinine. And going back to this 2020 article, the authors remind us that creatinine is the nitrogenous waste product of phosphocreatine. Phosphocreatine is the primary energy source for contracting muscle cells. The amount of creatinine in the blood will be determined by:
- How much muscle contraction is occurring (more muscles=more contractions, less muscles=less contractions)
- How much is inputted from the diet
- How much is eliminated by the kidneys
The authors report that only 24-38% of eGFR calculations will fall within the clinically relevant accuracy standard!
Check out the results of the study. Below is a snip from figure 3 from their paper. Notice that for total lean body mass the line has a downward slope. Showing how as lean body mass goes up, the eGFR appears to go down.
Take Aways
My take aways are:
- Muscle mass (either very high or very low) will impact eGFR calculations.
- For patients that are stable in their high or low muscle mass, tracking eGFR trends over time might still be OK, but won’t be accurate for telling you their true kidney function.
- For patients who loose muscle mass – consider that eGFR could be overestimating
- For patients who gain muscle mass – consider that eGFR may be underestimating.


2 thoughts on “Can you trust eGFR calculations on athletes or people with cachexia?”